Boller & Chivens CCD Spectrograph (CCDS)
at the MDM Observatory
CCDS News
- 2009 March 14
- qccds is a CCDS Quick-Look Tool based on
pyraf that performs quick spectral extractions of CCDS data with IRAF apall.
Written by John Thorstensen and available at MDM.
- 2008 November
- A new 1200x800 CCD (OSU Loral C) has been installed in the CCDS
dewar. It has lower readout noise (3.5e-) and better cosmetics.
- 2006 November 1
- New grating commands have been
introduced to make setting Zero-th
order and resetting the mechanism easier. The grating tilt system
has also been recalibrated.
- 2005 September 1
- Jen Marshall and Darren DePoy installed and commissioned a new
CCD-based slit viewing camera to replace the aging ISIT camera. Please
read the CCDS Acquisition Camera User's
Manual (476k PDF) for instructions on how to use this camera.
- 2005 February 1
- Jen Marshall at OSU provided revised measurements of the properties
of the 1800 line/mm grating based on observations at the 2.4m.
- 2003 November 10
- The OSU copy of the CCDS Manual became the official copy on 2003
November 10. All other copies you might find on the web are guaranteed
to be out of date after this date.
- 2002 January 10
- The grating drive mechanism has been repaired. However, the angle
of zero order as read on the grating drive mechanism dial on the
spectrograph now reads -6.03 degrees instead of about 0.0 degrees as
before. The new encoder zero point has been updated in the Prospero
software. Grating tilt operations from Prospero should continue to work
as before.
- The timeout problem associated with the below-slit filter slide and
the positioning of FILTER 5 has been fixed. Users should no longer
encounter the timeout message when selecting FILTER 5.
Contents:
Summary
The Boller and Chivens CCD Spectrograph (CCDS) is a conventional optical
grating spectrograph operating in the 3200-9500Å region. It is
used on the MDM Observatory 2.4-m and 1.3-m telescopes as a facility
instrument. It was acquired by the Ohio State University through a
grant from the National Science Foundation in 1970 for stellar spectral
classification programs and was used for about 28 years (1970-1998) on
the Perkins 1.8-m telescope on Anderson Mesa in Arizona. It was moved
to MDM in 1999.
Seven diffraction gratings are available providing a range of spectral
resolutions of 550 to 9100. The slit width is continuously adjustable
between 0.5 and 13 arcsec. The current science detector is a Loral 1200
× 800 CCD utilizing permanent backside charging and a dual-layer
anti-reflection coating which provide high quantum efficiency between
3200 and 9500 Å. The CCD read noise is typically 7 electrons and
the gain is nominally set at 2.1 electrons per ADU. Lamps located in the
MIS box at each telescope are used for wavelength and flat-field
calibration. With the lowest dispersion grating in first order, the
peak system quantum efficiency is about 19% at 5200Å.
A thermo-cooled SBIG ST-9 CCD camera is used to image the polished
entrance slit jaws of the CCDS for target acquisition. In brief
5-second integrations it is possible to acquire point sources as faint
as V=20th magnitude. Please read the CCDS
Acquisition Camera User's Manual for details.
Pictures of the CCDS:
On 2.4-m,
Northwest,
Southwest,
Southeast,
Northeast
CCD Characteristics & Parameters
Measured 2008 Oct 15 [rwp]
- Dimensions: 1200 × 800; 15µm square pixels
- Manufacturer: Loral
- Designation: OSU Loral C
- Read noise: 3.5 electrons
- Gain: 1.5 electrons per ADU
- Linearity: Linear to 65000 ADU
- Quantum Efficiency Curve
- Orientation: Shorter wavelengths are at smaller column numbers; East
on the slit corresponds to smaller row numbers
- Pixel scale: 0.41 arcsec per unbinned pixel (2.4-m); 0.75 arcsec per
unbinned pixel (1.3-m)
- Unvignetted slit length: 5.2 arcmin (2.4-m); ~10 arcmin (1.3-m, but
has not been measured yet)
- Dual-layer anti-reflection coating for broad wavelength sensitivity
(400 Å HfO2 + 900 Å MgF2 coatings)
- Thinned and packaged by the University of Arizona Imaging Technology
Laboratory
- Mounted and interfaced by the OSU Imaging Sciences
Laboratory
Detector format, binning, and overscan regions are user selectable
options.
Gratings and Spectral Information
The table below summarizes the characteristics of the gratings available
for use with the CCDS. The values tabulated for the dispersion, spectral
coverage, and spectral resolution have been calculated but appear to be
accurate when compared with actual data obtained with the CCDS. We also
give the approximate collimator focus measured at 20°C for as many
gratings as we have information. Updates will be forthcoming.
Grating
(grooves per mm) |
Blaze
(order, angle, wavel) |
Dispersion
(Å/pixel) |
Coverage
(Å) |
Resolution (Å)
1 Arcsec slit
87 µm @ 2.4-m |
Resolution (Å)
1 arcsec slit
47 µm @ 1.3-m |
Approx
Collimator
Focus
@20°C |
Notes |
150 |
1st / 2.15 / 4700 |
3.29 |
3650 |
8.2 |
4.4 |
850 |
c |
158 |
1st / 3.63 / 7530 |
3.16 |
3650 |
8.1 |
4.1 |
|
a, c |
350 |
1st / 4.30 / 4026 |
1.33 |
1592 |
3.4 |
1.9 |
850 |
c |
600/1 |
1st / 8.63 / 4700 |
0.79 |
953 |
1.9 |
1.0 |
910 |
c |
600/2 |
2nd / 22.03 / 5875 |
0.41 |
495 |
0.8 |
0.4 |
|
b, c |
1800 |
1st / 26.75 / 4700 |
0.275 |
330 |
0.825 |
0.3 |
|
b,c,d |
- Notes:
- (a) The 158 gpm grating is currently mounted. Please contact OSU
as to its availability.
- (b) Undersampled at the 2.4-m telescope.
- (c) Undersampled at the 1.3-m telescope.
- (d) Measured at the 2.4-m by J. Marshall, 2005 Feb 1.

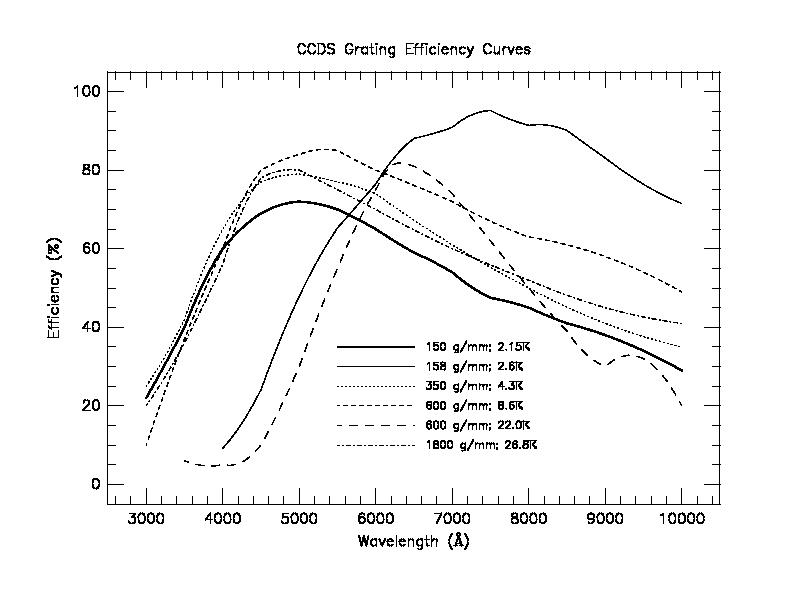
The above graph shows
the measured grating efficiencies as reported by the manufacturer as a
function of wavelength. Users should note that these curves were
measured in a specific laboratory setup (Littrow configuration) and thus
may not be applicable to the CCDS. Note that the 1800 gpm grating
has a strong polarization dependence on its measured efficiency curve
that is not shown above and which is based on unpolarized light.
They are provided here for relative comparison only. Quantitative
performance estimates should use the information provided below based on
the spectra of standard stars with the CCDS.
Performance and Throughput
- Throughput:
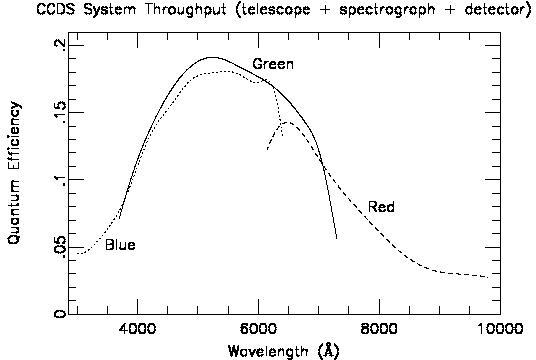
- The sensitivity function shown below is the convolution of
contributions from the Hiltner 2.4-m telescope and its reflective
surfaces, the spectrograph and its optics, and the detector. It was
derived based on spectra of the standard stars BD+28 4211 and Hiltner
102 obtained under photometric conditions on August 21, 1999. To avoid
light losses which would affect the measurement, the slit was widened to
13 arcsec. The 150 gpm grating was employed and was centered at 4400
Å (blue), 7970 Å (red), and 5500 Å (green)
respectively. Exposure times were 100 s in the blue, 240 seconds in the
red, and 100 seconds in the green. No order separation filters were
used. The stellar spectra were extracted from the frames with sky
subtraction and were corrected for the effects of atmospheric
extinction, but were not flat fielded.

- Count Rates:
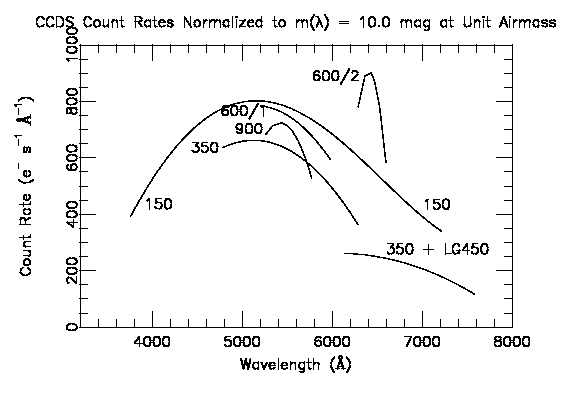
- We have measured the counting rate of the CCDS for each grating at
the 2.4-m telescope and the results are presented in the table
below. The count rates given for the 1.3-m telescope are estimates and
simply reflect the difference in aperture with respect to the
2.4-m. After we obtain actual measurements at the 1.3-m we will replace
the estimates given in the table with the measurements. The count rates
in the table are given in e-/sec/Å in an extracted
spectrum at 5556 Å for a star of monochromatic magnitude m(5556) =
10.0 at unit airmass. In the plot below, we show graphically the count
rate as a function of wavelength for each CCDS grating normalized such
that m(lambda) = 10.0 at unit airmass in order to illustrate the
wavelength dependence.
|
Count rate (e-/s/Å)
for m(5556) = 10.0 mag
at unit airmass for CCDS |
Grating |
Hiltner 2.4-m |
McGraw Hill 1.3-ma |
150 |
730 |
214 |
350 |
592 |
174 |
600/1 |
650 |
220 |
600/2 |
840b |
246b |
1800 |
688c |
202c |
- Notes:
- (a) Count rate estimated from 2.4-m count rate based on ratio of
collecting areas.
- (b) Count rate at 6436 Å. Designed for use at H-alpha.
- (c) Count rate at 5710 Å.

Note: the 900l/mm grating depicted above is no longer available.
Slit Width Adjustment
The slit consists of two 2.5" long polished and aluminized
jaws. This is a biparting slit and the jaws are continuously adjustable
over a range from 10 to 1100 microns. Both jaws move in the direction of
the slit length for changes in slit width. The jaws remain parallel up
to widths of at least 900 microns. For larger openings, some tapering of
the slit might be noticed.
The slit width is controlled by the setslit
<n> command where
<n> is the slit width in microns. The
following table lists the physical slit widths in microns at the 2.4-m
and 1.3-m telescopes respectively for some popular slit widths in
arcseconds. The unvignetted slit length at the 2.4-m telescope is 5.2
arcmin while at the 1.3-m telescope we believe it is approximately 10.0
arcmin, however, it has not been measured yet.
|
Width
(arcsec)
|
Width (microns)
@ 2.4-m
|
Width (microns)
@ 1.3-m
|
|
1.0
|
87
|
47
|
|
1.5
|
131
|
71
|
|
2.0
|
174
|
94
|
|
3.0
|
261
|
141
|
|
5.0
|
435
|
235
|
|
7.5
|
653
|
353
|
|
10.0
|
870
|
470
|
|
12.0
|
1044
|
564
|
CCDS filters
The CCDS has two internal filter slides and both positioned through the
software. The above-slit filter slide, called the
prefilter, carries 4 neutral density filters made of
quartz which can be used to alter the intensity of the lamps in the MIS
box. They can be used for slit targets as well but target acquisition
using the slit-viewing CCD camera will be difficult or impossible. The
four filters are as follows: (1) ND0.5 (1.25 mag), (2) ND1.0 (2.5 mag),
(3) ND1.5 (3.75 mag), and (4) ND2.0 (5 mag). For normal operation, the
prefilter slide is moved out of the telescope beam with the
prefilter 0 command. The
prefilter positions are summarized in the table below.
Each filter measures 0.35 x 1.5 inches with a maximum thickness of 0.20
inches.
The below-slit filter slide is referred to as the
filter. It carries five order separation filters to block
light from higher orders. They are called (1) LG350, (2) LG370, (3)
LG400, (4) LG450, and (5) LG505.. All of these filters are long-wave
passband filters. The number in the filter designation identifies the
wavelength in nanometers at which 50% maximum transmission occurs. The
filter slide is moved out of the telescope beam with the
filter 0 command. The filter positions are
summarized in the table below.
Note:
Insertion of an order separation filter moves the focus of the CCDS
approximately -50 units as measured, on the collimator dial or defined
by the setfocus command, with respect to the best focus without a
filter.
|
Position
|
Filter
|
PreFilter
|
|
0
|
Retracted
|
Retracted
|
|
1
|
LG350
|
ND 0.5
|
|
2
|
LG370
|
ND 1.0
|
|
3
|
LG400
|
ND 1.5
|
|
4
|
LG450
|
ND 2.0
|
|
5
|
LG505
|
|
Plot of the LW350-LW505 filter transmission
curves
FILTER=*HI* Condition:
The CCDS mechanism control computer (the "IE") can occasionally get into
a state where it reports the filter and/or prefilter ID as
"*HI*". This means that the controller thinks either filter
insert mechanism has been pushed into the high limit switch. In fact,
it probably isn't, but no matter, it thinks it is, and as a safety
measure it refuses to allow you to set the filter or prefilter, with
ensuing confusion.
If this happens, issue the following Prospero commands
   FILTER RESET
or
   PREFILT RESET
as required to clear the condition. These commands override the
high-limit safeties and drive the filter/prefilter mechanism back to the
"zero" or "home" position. Once the (bogus) high limit assertion is
cleared, you can move the filter and/or prefilter to the desired
positions.
Comparison Lamps & Spectral Templates
Emission-line Lamps currently available for wavelength calibration
include HgNe, Ne, Ar, and Xe. They are enabled through the MIS software
and can be used individually or in any combination. We hope to add a
HeAr or HeNeAr Cd hollow cathode source in the near future. Templates
and line lists for the MIS box emission line lamps are given below for
display and download. Hardcopy plots are also available in the CCDS
notebook in the respective control rooms. The line lists can be combined
in any combination. Their format is IRAF compliant. Below are some notes
regarding use of the lamps:
- Hg lamp:
- This lamp requires as much as 30 seconds to warm up. After warm up,
the HgNe spectrum will be replaced by a strong Hg spectrum only. When
using the Hg lamp it is necessary to use an ND1.0 filter to cut down on
the intensity of the light. With the 150 gpm grating the exposure time
is at most a few seconds. Observers should start with the ND1.0 or
perhaps ND1.5 filter if they are unsure of the proper filtering for
their chosen grating and slit width. The Hg line list includes 2nd order
blue lines visible in the 1st order red. For low resolution applications
in the 3200-7000 Å region, the Hg and Ne lamps provide a good
array of strong lines.
- Hg Plots: (3300-6900 Å),
(enlarged), (6550-9900
Å), Hg linelist
- Ne lamp:
- The Ne lamp contains strong lines in the red beginning at 5700
Å. A filter should not be necessary. The Ne lamp should be used
in conjunction with the Ar lamp to construct a dense comparison lamp
spectrum spanning the red and blue spectral regions respectively, but be
careful balancing the exposure times since the Ar lamp is considerably
weaker. The Ne lamp is not useful below 5300 Å.
- Ne Plots: (5300-6800 Å),
(enlarged), (6500-9900
Å), (enlarged), Ne
linelist
- Ar lamp:
- The Ar lamp is relatively weak and does not require a filter. An
exposure of 120 sec with the 600/1 grating centered at 4700 Å gave
an adequate spectrum for cross-correlation with a longer exposed
template.
- Ar Plots: (3300-6900 Å),
(3300-5300 Å), (5000-7000
Å), (6550-9900 Å),
(enlarged), Ar linelist
- Xe lamp:
- The Xe lamp provides two clusters of bright lines: one at roughly
4500-5000Å, and the second at between 8000 and 10000Å, with
many lamps in between. It is a useful lamp to use for blue spectra
where you need to fill in the numerous gaps in calibration line coverage
below about 5000Å.
- Xe Plots: (3300-7000 Å),
(enlarged), (4000-6000
Å), (6550-9900 Å),
(enlarged), Xe linelist
- All Lamps:
- You can download a complete set of PostScript versions of these plots and the
ASCII format line lists ready for use in IRAF using the link below
ccds_lamps.tgz (128k gzipped tar file)
- Flatfields:
- The MIS box lamp set includes an incandescent light bulb that
produces a continuous (essentially thermal) spectrum. This source can be
used to illuminate the slit and thus to obtain internal flatfields. At
present the lamp is far too red to construct flatfields for the CCDS in
the blue parts of the spectrum. The dome screen can also be used but
has the same limitations as the internal lamp. We hope to replace the
internal lamps with higher intensity quartz-halogen lamps in the near
future.
Operations Manuals
Additional Documentation & Information


