Low-Mass stars take longer to form than High-Mass stars.
Progressive Evolution
As a cluster ages:
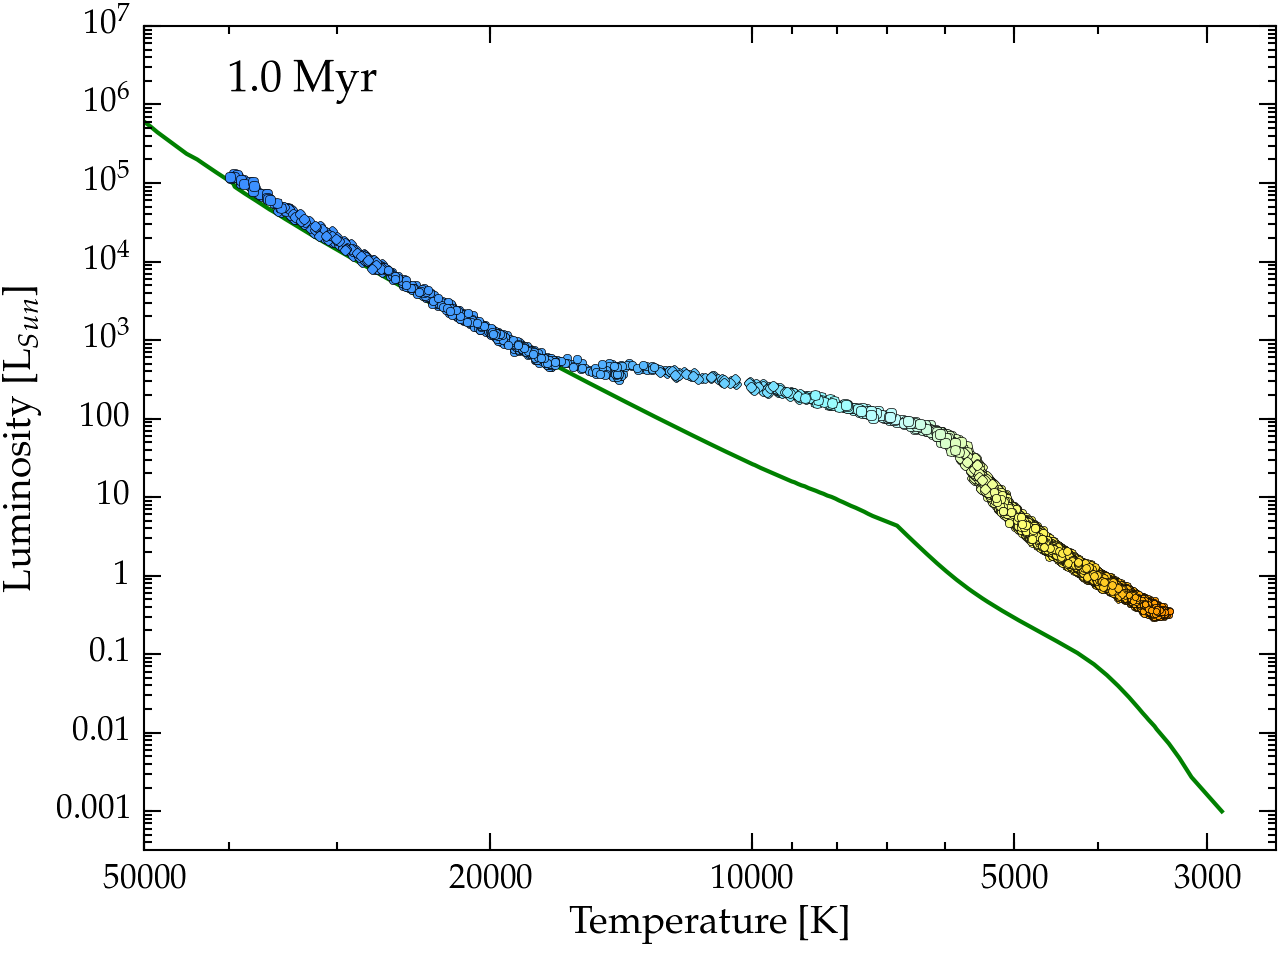
Start with high-mass stars on the M-S, and low-mass stars
still approaching.
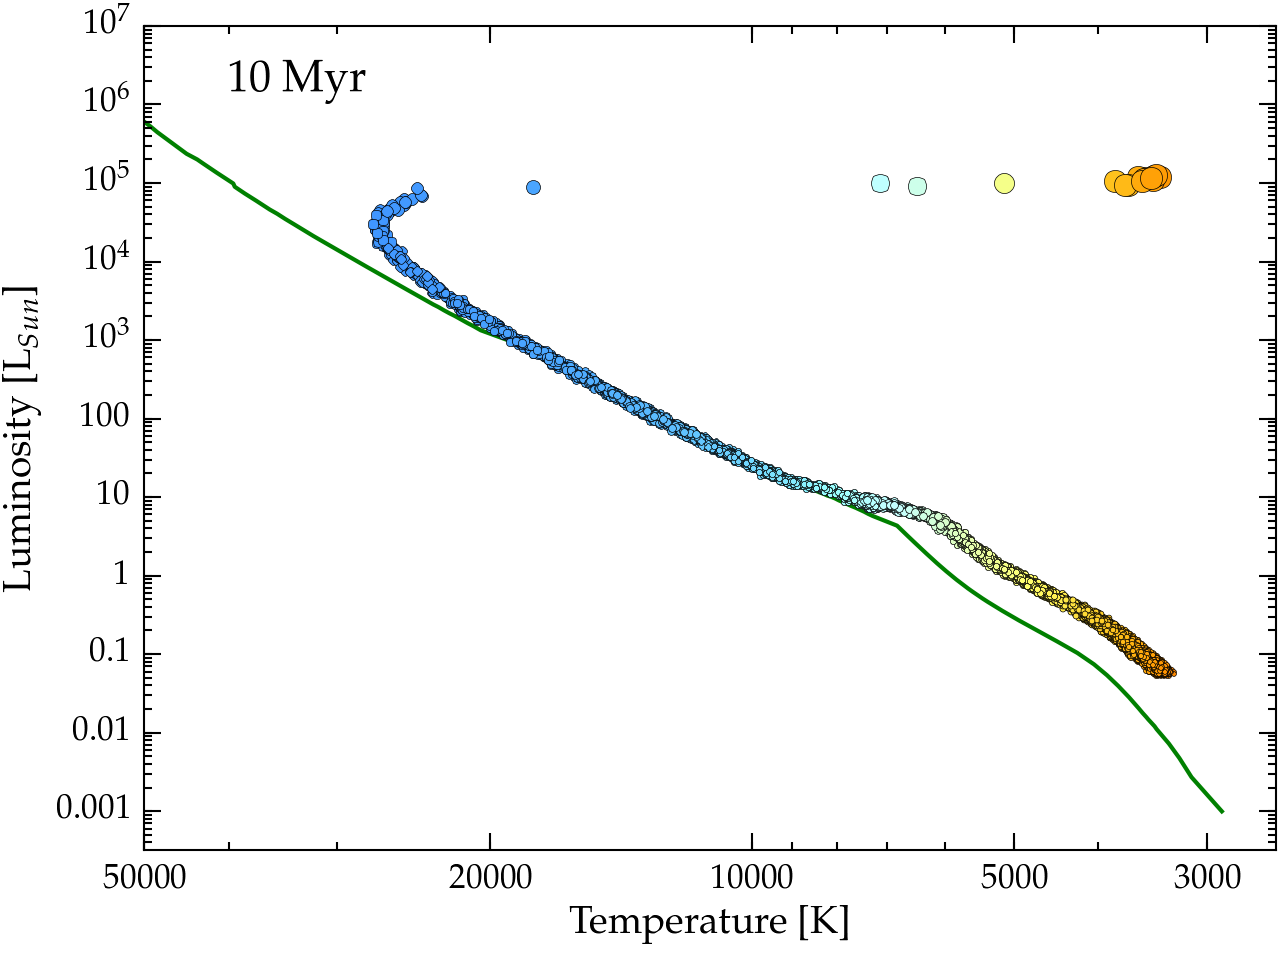
High mass run out of hydrogen in their cores first, evolving
off into supergiants.
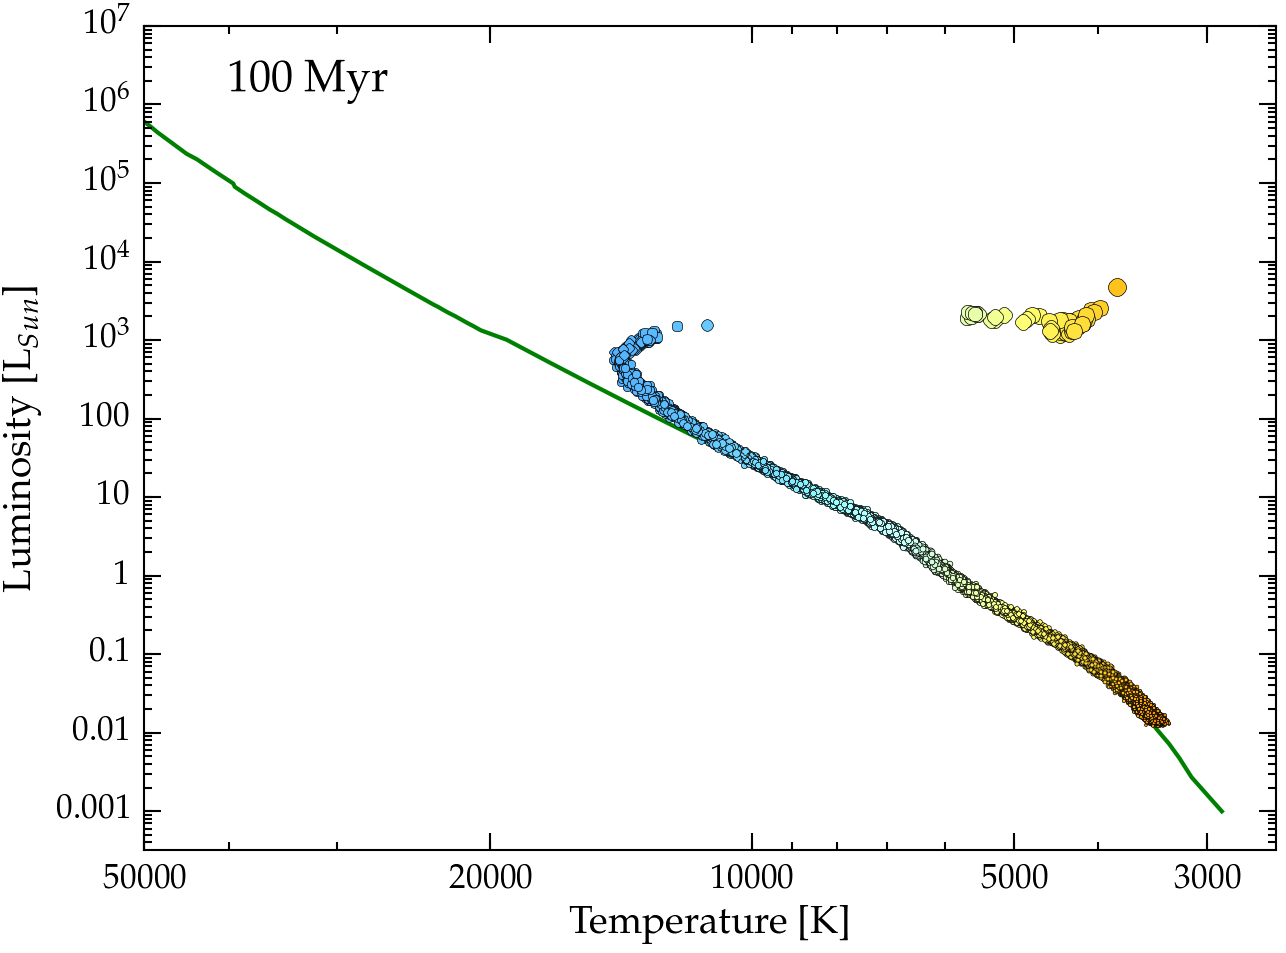
As successively lower mass stars run out of hydrogen in their
cores, they too evolve off.
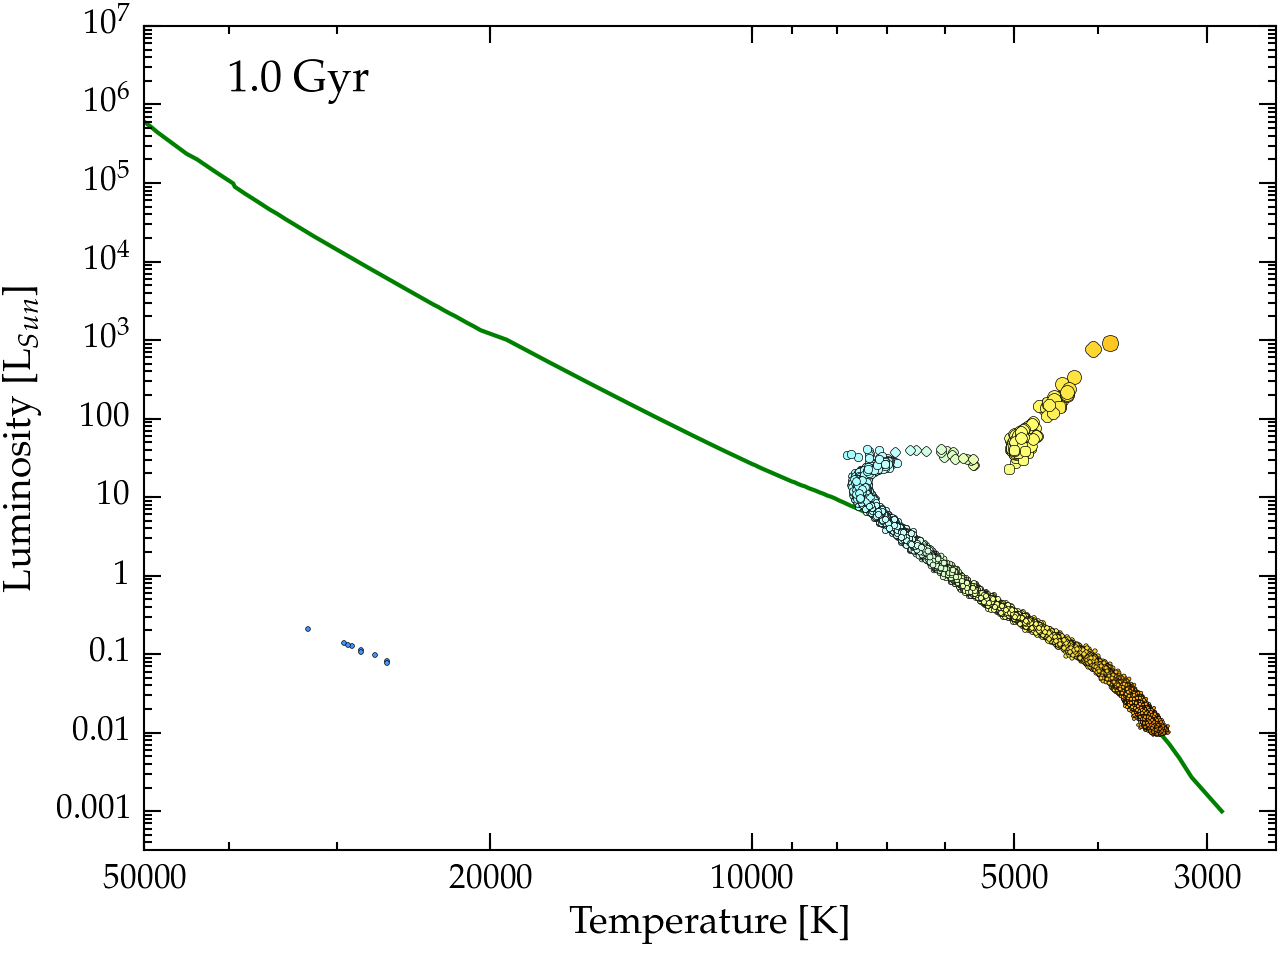
Effect is that stars peel off the Main Sequence from the top (high-mass end)
down as the cluster ages from 1 Myr to 10 Gyr.
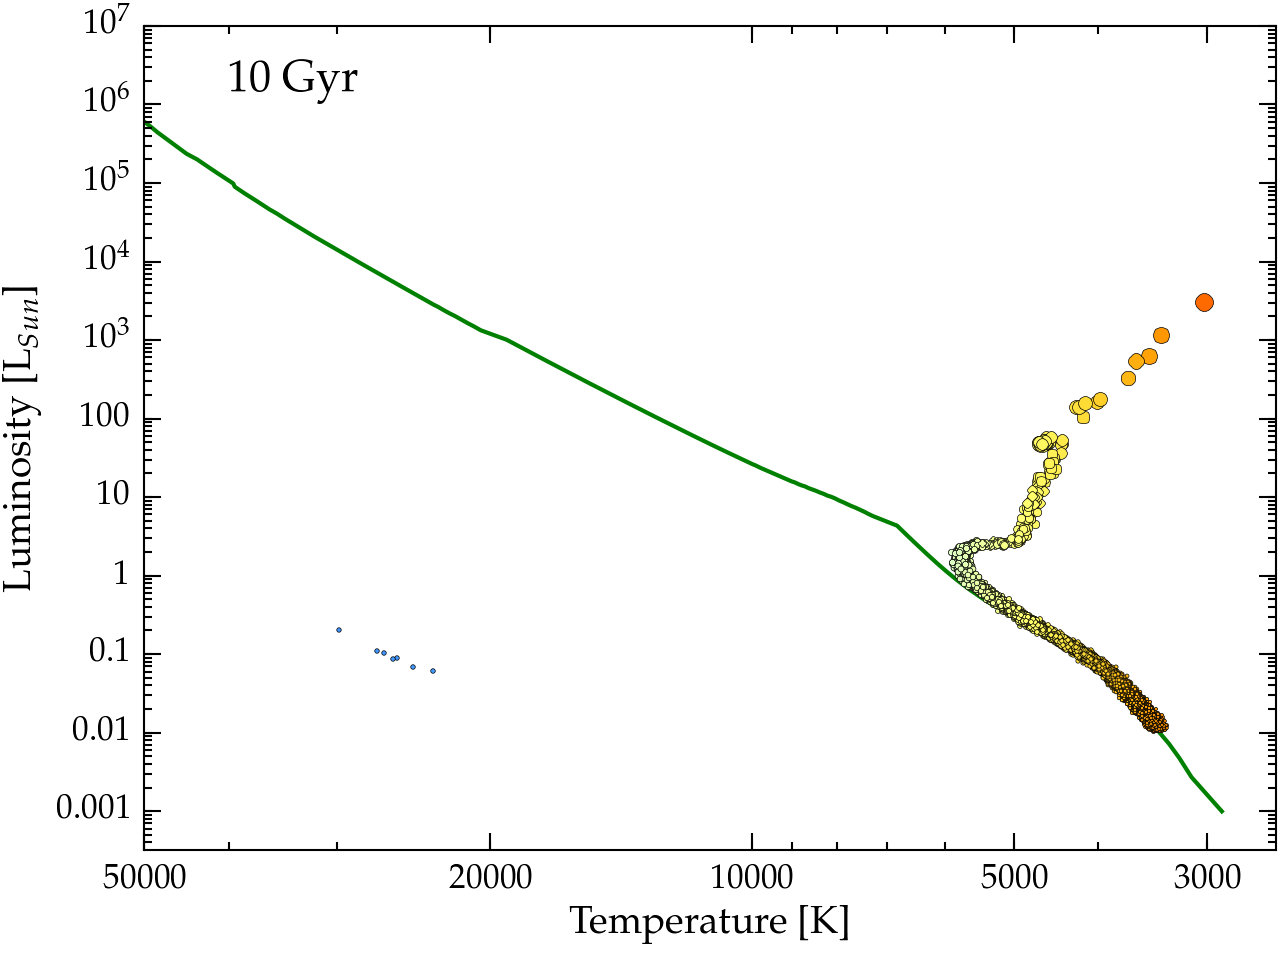
H-R Diagrams of a Simulated Star Cluster
This simulated star cluster has 30,000 stars with masses from 0.3 to
30Msun. Stellar evolution calculations from
the MIST v1.1 database
were used.
The plots below show snapshots of the cluster at 1 Myr through 10 Gyr.
The green line in each shows the location of the zero-age main sequences (ZAMS).
Click on an individual H-R diagram above to view the full-resolution version.
Watch this animation of the full cluster simulation showing the evolution
of the H-R diagram from an age of 100 kyr to 19 Gyrs (YouTube video):
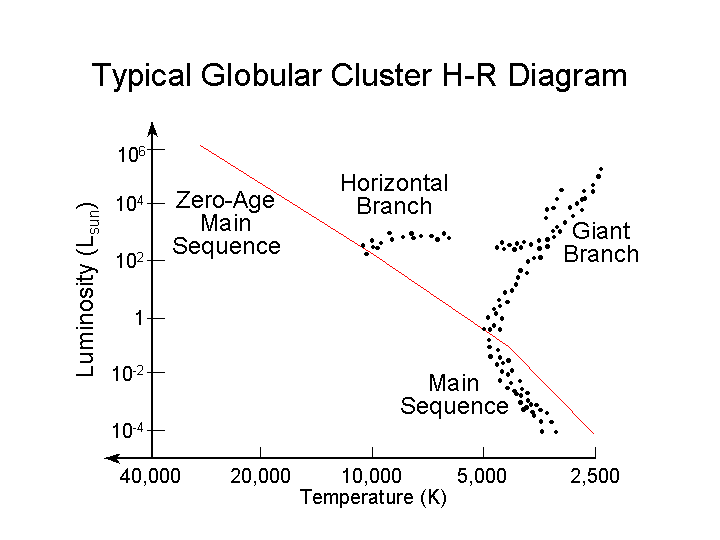
Main Sequence Turn-off
Point where the Main Sequence "turns off" towards giant
stars.
As cluster ages, the stars at the turn-off are lower mass
Low mass stars have redder colors.
Color of the turn-off is an indicator of the cluster age:
Slightly bluer and fainter Main Sequence due
to having less metals than nearby stars
Conclusions
Cluster H-R Diagrams give us a snapshot of stellar evolution.
Observations of clusters with ages from a few Million to 15 Billion
years confirms much of our picture of stellar evolution.
Piecing together the story of Stellar Evolution has been a triumph of
observational and theoretical work. We still have many questions to
answer, but the big picture is secure.