As part of paper VI in the DIRECT series, entitled "Variables in the
Central Part of
M33", by Macri et al., we cross-identified previously-known variables
in this galaxy
with the ones discovered by our survey.
One of the most extensive surveys previously undertaken in this galaxy
was the one
carried out by Hubble in the 1920s. We were able to recover all the
Cepheids he had found,
and determined periods that are consistent with his, within the measurement
error. The only
exception was V11, originally classified as a 23.4-day Cepheid, which
turned out to have a
period of 13.0 days).
There was one Cepheid from Hubble's sample, designated as V19, which
was
supposed to be present in our survey area, that we were unable to recover.
This was
very puzzling because V19 was supposed to have a period of 54.7 days,
making it one
of the brightest Cepheids in the galaxy. Thus, it should have been
extremely easy to locate.
We found a bright star at the location indicated by Hubble, but it is
not pulsating anymore!
Furthermore, it has brightened by about half a magnitude in the last
eighty years!
How do we know that Hubble didn't simply mark the wrong star in his
finding chart? Well,
if that were the case, then we should find a Cepheid with a period
of about 55 days some-
where else in our extensive coverage of the disk of M33 (more than
400 square arcminutes,
at this point). No objects matching the description of V19 have been
found. Even more
compelling is the fact that another survey of M33, undertaken in the
1980s by Kinman, Mould
& Wood, should have found this object but did not do so. They surveyed
M33 using photo-
graphic plates, and covered a much greater area than we did.
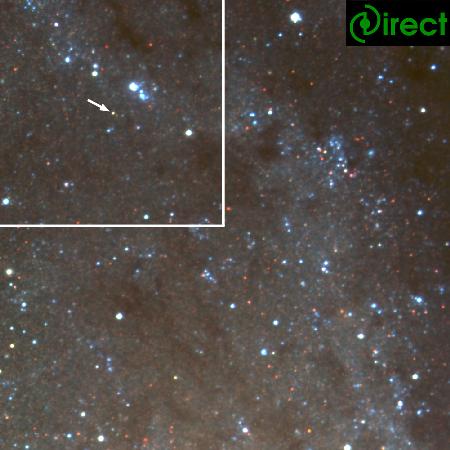
This image shows the location of V19 in the disk of M33. The region
shown here is about 5
arc-minutes on a side. The arrow points to the former variable; the
area enclosed by the
white lines is shown in greater detail below.
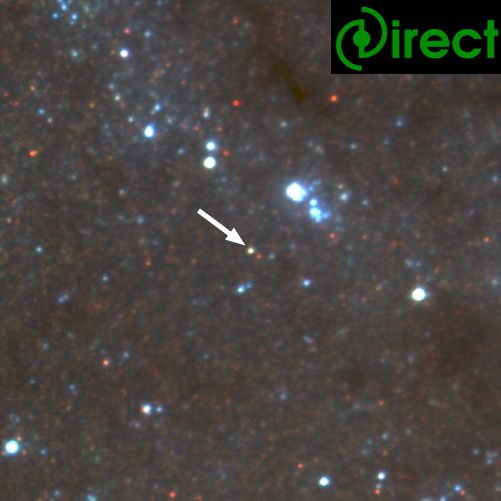
Here is a close-up view of the area surrounding V19. The region shown
here is about
2 arc-minutes on a side.
This plot shows the phased B-band light curve of V19, measured by Hubble
in the 1920s,
transformed into the modern magnitude system:
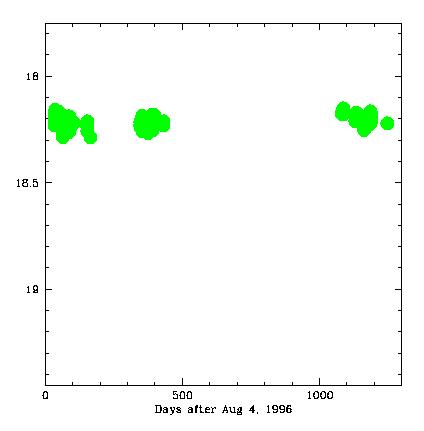
The next two plots show the current behavior of V19, measured by the
DIRECT project in
1996, 1997 and 1999, in the B and V bands. The scatter of the points
is consistent with no
variability. All three plots have the same vertical scale.
A PostScript copy of the paper (to appear in the ApJL), and scientifically
useful
finding charts and light curves, can be found here,
in our FTP directory.