|
Astronomy 162:
Introduction to Stars, Galaxies, & the Universe
Prof. Richard Pogge
|
Characteristics of the Stellar Spectral Types
Click on the images of the spectra to see a higher-resolution
GIF version (1280x127 pixels, ~40Kb each).
O Stars

Hottest Stars: T>30,000 K; Strong He+ lines; no H lines
(or only very weak at O9).

Spectrum of an O5v star
B Stars
T = 11,000 - 30,000 K; Strong neutral He lines; very weak H lines, getting
stronger from B0 through B9.


Spectra of B0v (top) and B5v (bottom) stars
A Stars
T = 7500 - 11,000 K; Strongest H lines, Weak Ca+ lines emerge
towards A9 types.


Spectra of A1v (top) and A5v (bottom) stars
F Stars
T = 5900 - 7500 K; H grows weaker through F9, Ca+ grows stronger,
weak metals begin to emerge.


Spectra of F0v (top) and F5v (bottom) stars
G Stars
T = 5200 - 5900 K; Strong Ca+, Fe+ and other metals
dominate, H grows weaker through the class.


Spectra of G0v (top) and G4v (bottom) stars
K Stars
T = 3900 - 5200 K; Strong metal lines, weak CH & CN molecular bands
begin to appear, growing through the class. H lines nearly gone.


Spectra of K0v (top) and K5v (bottom) stars
M Stars
Cool Stars: T = 2500 - 3900 K; strong molecular absorption bands
particularly of TiO and VO emerge and strengthen, as do
lines of neutral metals. Virtually no H lines anymore.


Spectra of M0v (top) and M5v (bottom) stars
L Stars
Coolest Stars: T = 1300 - 2500 K; strong molecular absorption bands
particularly of metal hydrides and neutral metals
like sodium, potassium, cesium, and rubidium. No TiO and VO bands.
[No spectra yet]
T dwarfs
T < 1300 K; very low-mass objects, not technically stars anymore
because they are below the Hydrogen fusion limit (so-called "Brown
Dwarfs"). T dwarfs have cool Jupiter-like atmospheres with strong
absorption from methane (CH4), water (H2O), and
neutral potassium.
[No spectra yet]
Comparison of Type V Dwarf Star Spectra
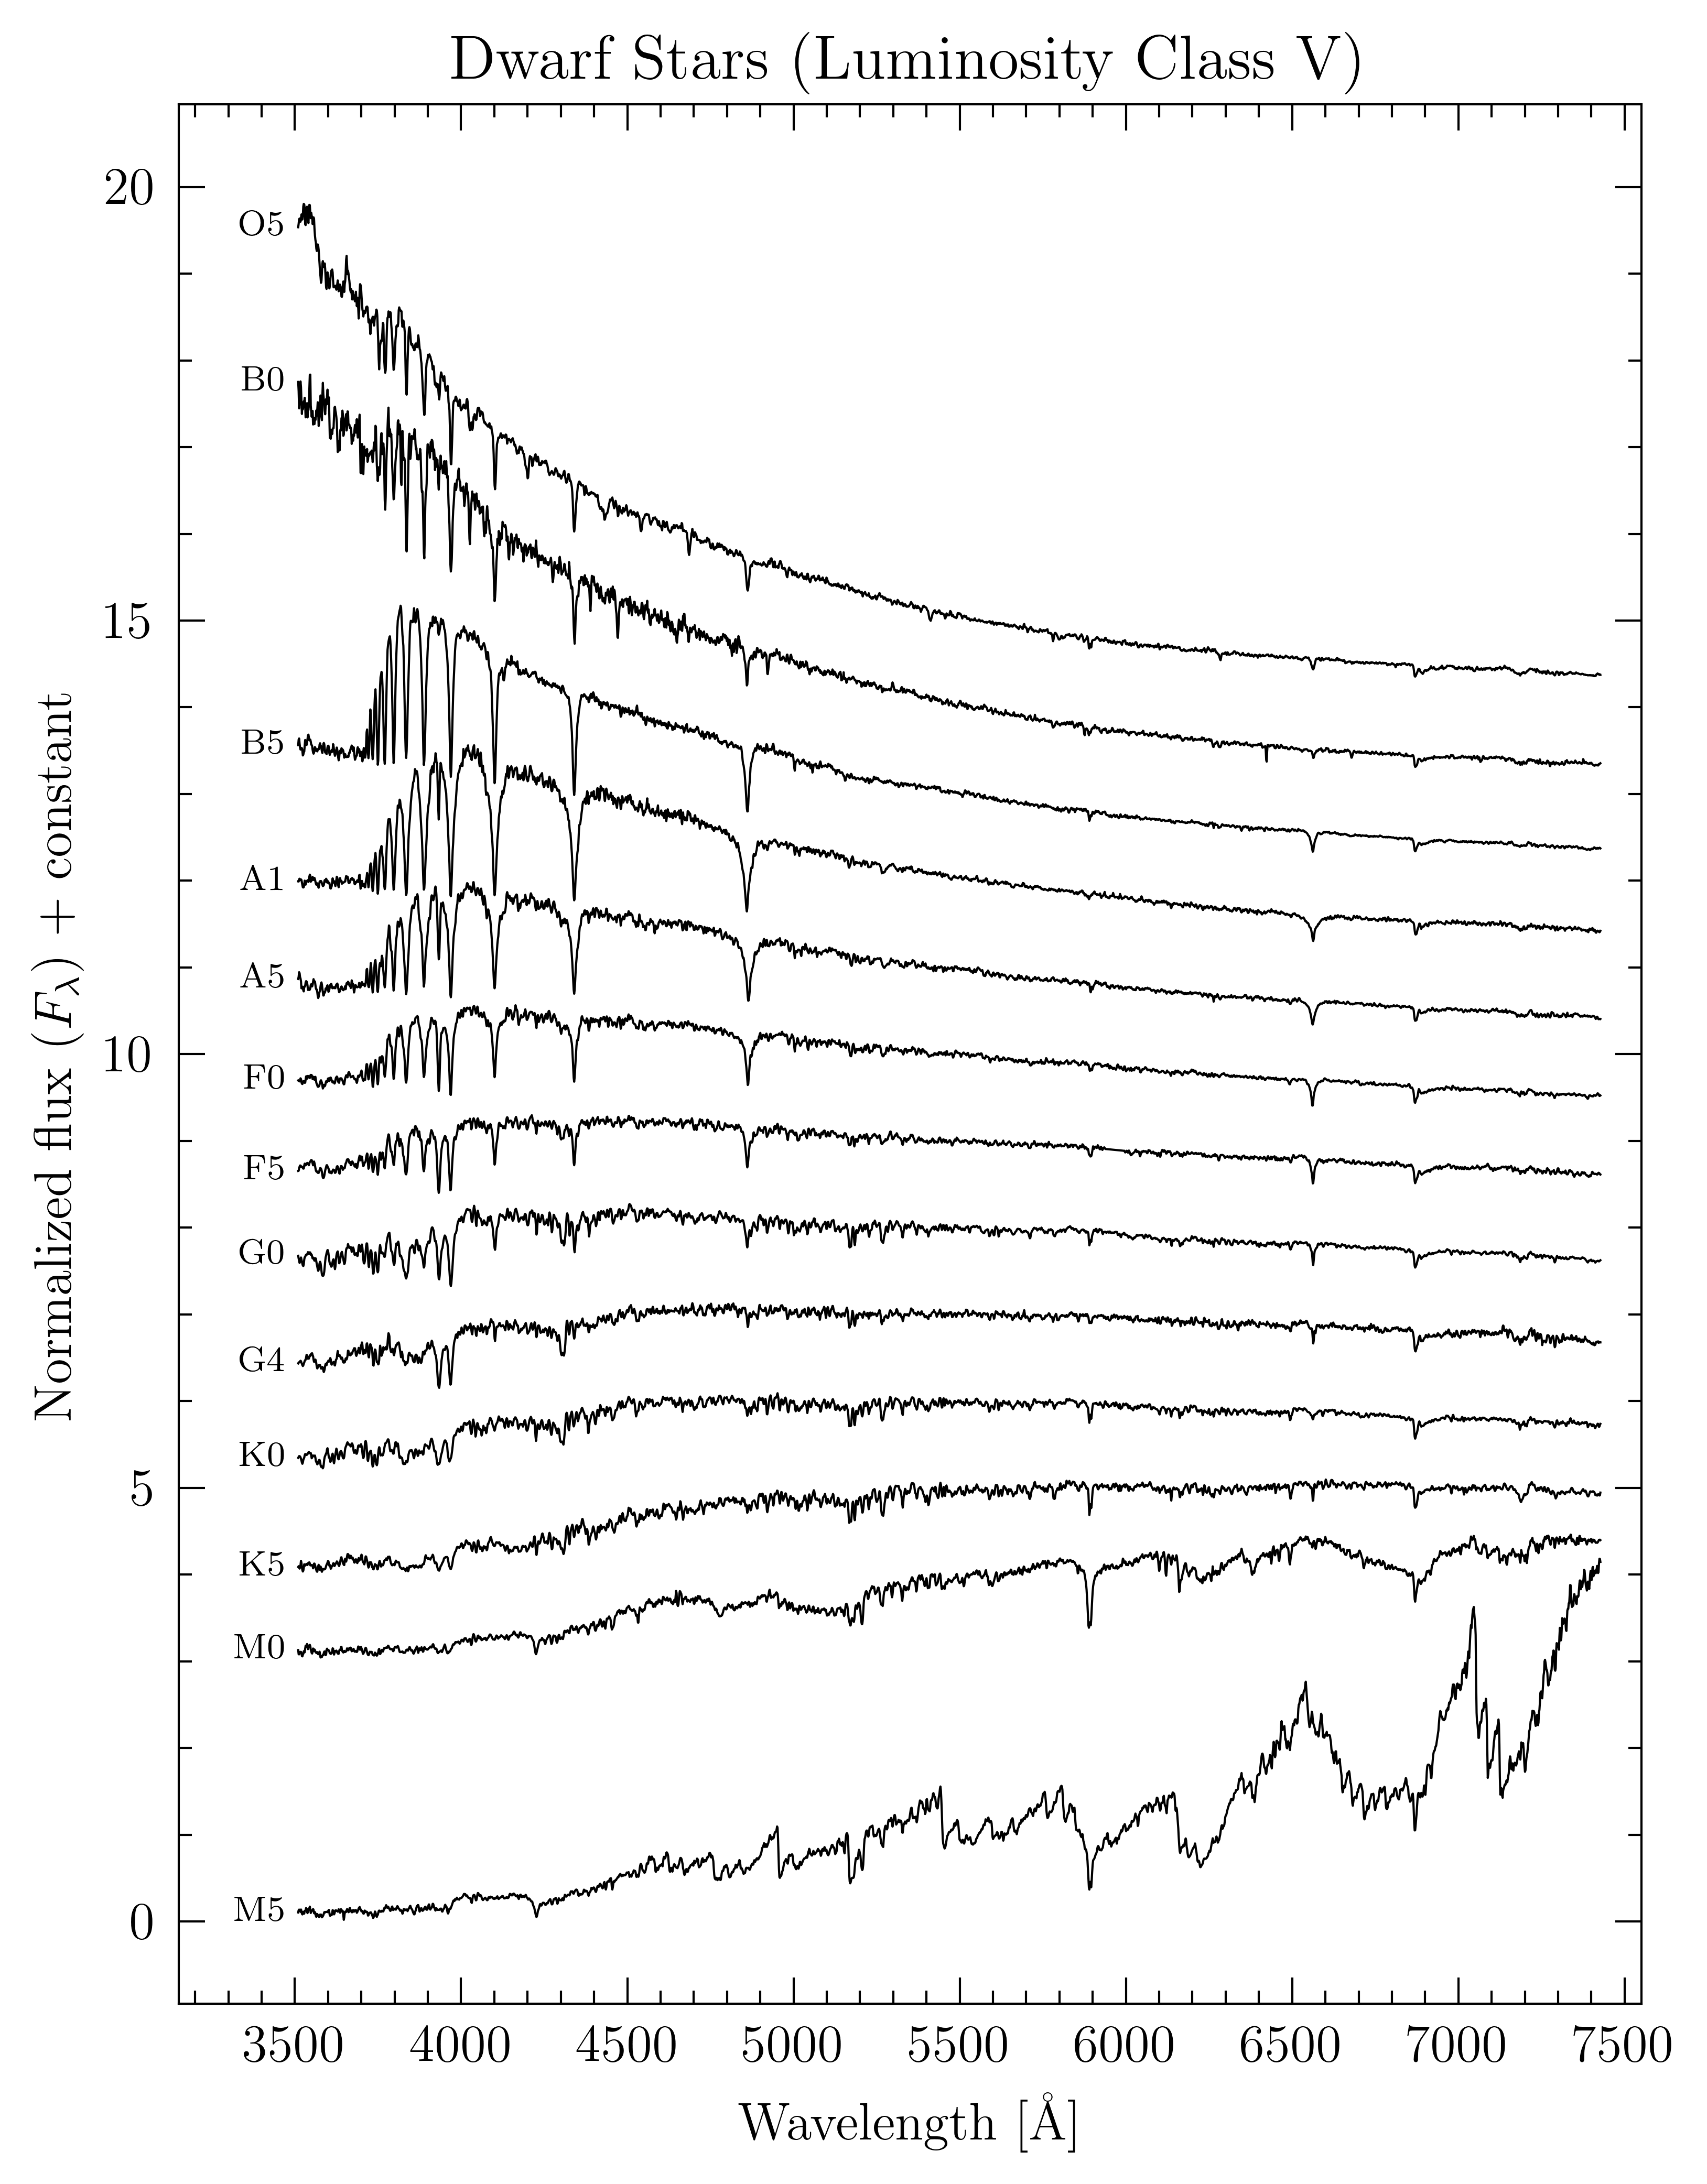
A stack of all of the spectral images showing how the spectral features
change systematically from types O5v through M5v is shown on this page.
Notes on the Graphics
The spectra shown above are for real stars and run from 350nm to 740nm.
I've taken digital scans of the spectra and "stretched" them into
black-and-white images to mimic the photographic spectra used for many
years for classification. The main difference between these images and
photographic plates is that the latter did not generally extend as far
into red wavelengths as modern CCD detectors. Putting two spectra close
together like this shows clearly how the spectra change from the start
to the middle of the class.
The line graph above shows the source spectra that
went into each of the stretched versions. The original source spectra are
from Jacoby, G.H., Hunter, D.A., & Christian, C.A.
A Library of Stellar Spectra, 1984, ApJS, 56, 257.
The pictures of the stars are computer renderings of a glowing sphere
with a color rendered approximately given its observed spectrum for that
type. The rendering was done by converting the spectrum into
approximate computer RGB colors using the Judd-Vos modified CIE color
matching functions and sRGB primaries and gamma function. The
"white point" for the color conversion was set to the standard for
sunlight (the "D65 white point"), hence a G2 star should appear whitish with
a tint of yellow (despite what artists and children with crayons will tell
you, the sun isn't really a bright yellow - the broad spectrum washes out
the color into more of a whitish hue when viewed by the eye). I do not
guarantee these color renderings to be 100% real, but I think they are about
as close as I can get and still get the basic idea of stellar
colors across that stellar colors are rather subtle because their
emissions span the entire visible spectrum. The "limb darkening" effect
you see is based on a simple empirical limb-darkening law for the
Sun.
The cartoon of a T-dwarf was taken from a graphic created by Dr. Robert
Hurt at IPAC.
Return to [
Lecture 8: Stellar Spectra
|
Unit 1 Index
|
Astronomy 162 Main Page
]
Updated: 2022 October 6
Copyright © Richard W. Pogge,
All Rights Reserved.