Astronomy 1144: Introduction to Stars, Galaxies, and Cosmology
Todd Thompson
Department of Astronomy
The Ohio State University
Lecture 3: The Interaction of Light & Matter
Temperature (Kelvin Scale)
Measures internal energy content of matter.
Kirchoff's Laws of Spectroscopy
Continuous (Blackbody) Spectrum
- Stefan-Boltzmann Law & Wien Law
Emission- and Absorption-Line Spectra
Each atom has a unique spectral signature
F = σSB T4
L = 4 π R2 σSB T4
λpeak = 2.9 × 10⁶ nm K/T
The Interaction of Light & Matter
Light & Matter can interact in a number of different ways:
- Matter can transmit light (glass, water).
- Matter can reflect light.
- Matter can gain energy by absorbing light.
- Matter can lose energy by emitting light.
The last two (absorption and emission) bear on the internal
energy of the matter:
matter can cool (decrease in temperature)
by emitting light or it can heat up (increase in temperature)
by absorbing light.
Temperature
Temperature is a measurement of the internal energy content of an
object.
- Solids:
- Higher temperature means higher average vibrational
energy per atom or molecule.
- Gases:
- Higher temperature means more average kinetic energy
(faster speeds) per atom or molecule.
Kelvin Temperature Scale
An absolute temperature system:
- Developed by Lord Kelvin (19th century)
- Uses the Celsius temperature scale.
Absolute Kelvin Scale (K):
- 0 K = Absolute Zero
- 273 K = pure water freezes (0ỳ Celsius)
- 373 K = pure water boils (100ỳ C)
The principal advantage of the Kelvin scale
is that the temperature measured
in Kelvins is directly proportional to the amount of internal energy in
an object. If you double the internal energy, you double the
temperature in Kelvins; that is, the Kelvin scale measures
absolute temperature. Both the Celsius and Fahrenheit systems
are difficult to use for relating the absolute energy content of objects
because they are tied arbitrarily to the freezing and boiling points of
water on the surface of the Earth. These are arbitrary since they
change even as a function of elevation (e.g., try boiling water on the
top of Mt. Whitney, California).
We will primarily use the Kelvin scale in this course.
Kirchoff's Laws of Spectroscopy
- A hot solid or hot, dense gas produces a continuous
spectrum.
- A hot, low-density gas produces an emission-line
spectrum.
- A continuous spectrum source viewed through a cool,
low-density gas produces an absorption-line
spectrum.
Gustav Kirchoff formulated these laws empirically in the mid-19th
century. While they adequately describe the different kinds of spectra
that are observed, they do not explain why these spectra appear
in these circumstances. It was not until the early 20th century, with
the development of quantum mechanics to explain the nature of the atom,
when we fully understood the origins of spectra.
Stefan-Boltzmann Law
Energy emitted per second per area by a blackbody with
Temperature (T):
F = σSB T4
where σSB is Stefan-Boltzmann's constant,
a number. F is the flux emitted by a blackbody surface.
In Words:
"Hotter objects emit more light (much more)
than cooler objects."
If we imagine a spherical blackbody of size R and
with temperature T, its luminosity is
L = 4 π R2 σSB T4
Two blackbodies that are the same size, but that differ by a factor of two in temperature, differe by a factor of 24=16 in luminosity.
Wien's Law
Relates the wavelength of maximum emission by a blackbody to its
Temperature:
λpeak = 2.9 × 10⁶ nm K/T
In Words:
- "Hotter objects are BLUER"
- "Cooler objects are REDDER"
Example: The Sun (and most stars) can be approximated as a blackbody.
The surface of the Sun is approximately 5800K. According to Wien's
Law,
the peak in the blackbody curve, the wavelength where most of
the light is coming out,
is λpeak&asymp 500 nm,
approximately in the blue part of the electromagnetic spectrum.
Examples
Heating a bar of Iron
Use a torch to heat an iron bar from 300K (room temperature) up to 600K.
- Temperature increases by a factor of 2
- Brightness increases by 24=16 times (Stefan-Boltzman Law)
- Peak wavelength shifts towards the blue by a factor of 2 from
about 10-microns in the mid-infrared to 5-microns.
The net result of heating any blackbody is that
- Gets brighter at all wavelengths
- Gets bluer in color
Person: Body Temperature = 310 K
- Peak wavelength = 9400 nm (infrared)
- Typical adults emit about 100 Watts of infrared light.
Sun: Surface Temperature = 5770 K
- Peak wavelength = 503 nm (visible light)
- Emits about 3.8x1026
Watts of mostly visible light plus some infrared and ultraviolet.
In Astronomy 162, we will use the properties of blackbodies, via the
Stefan-Boltzman and Wien Laws,
to help us understand some of the observed
properties of stars.
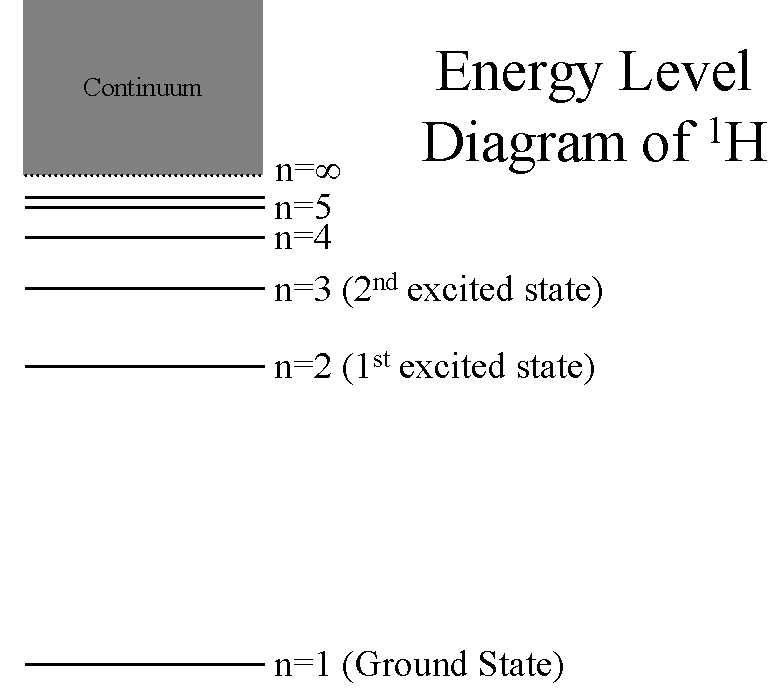
Hydrogen: The Simplest Atom
An atom of Hydrogen (1H) consists of:
- A single proton in the nucleus.
- A single electron orbiting the nucleus.
First orbital: Ground State (n=1)
- Lowest energy orbital the electron can reside in.
Higher orbitals: Excited States (n=2,3,...)
- Higher orbits around the nucleus.
- Come at specific, exact energies.
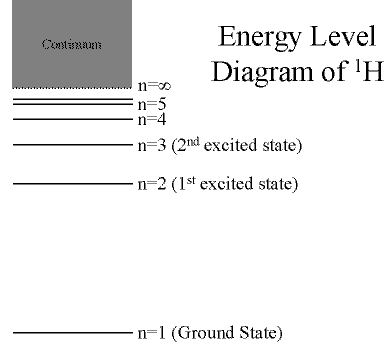
(Click on the image to view at full scale [Size: 8Kb];
Graphic by R. Pogge)
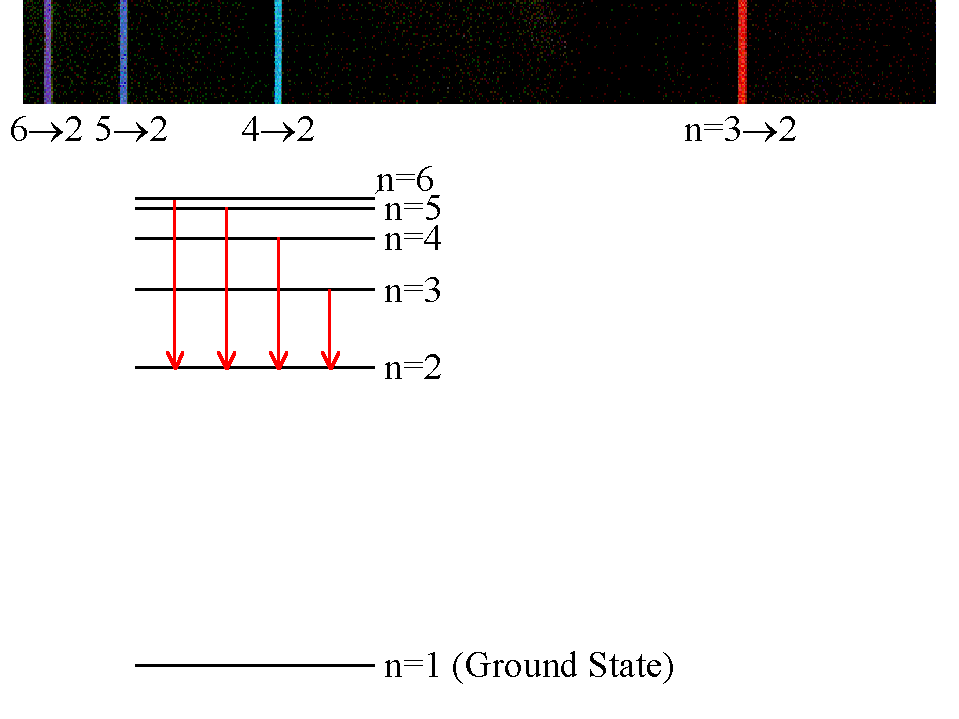
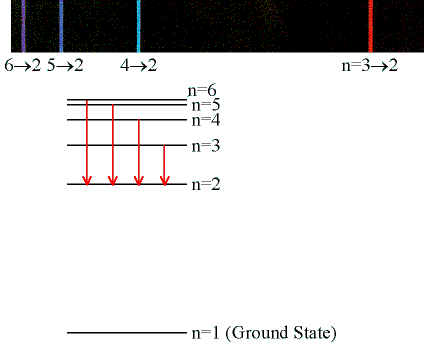
Emission & Absorption Lines
Emission Lines:
When an electron jumps from a higher to a lower energy
orbital, a single photon is emitted with exactly the
energy difference between orbitals. No more, no less.
(Click on the image to view at full scale [Size: 19Kb];
Graphic by R. Pogge)
Electrons can get into the excited states by either
- Colliding with other atoms or free electrons
- Absorbing photons of specific energies...
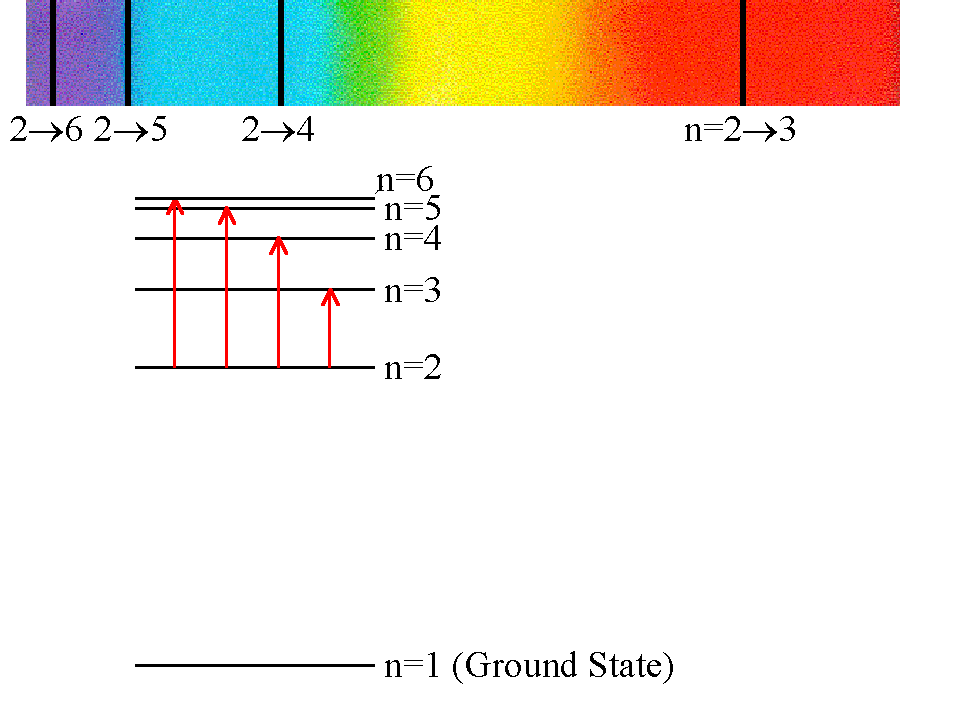
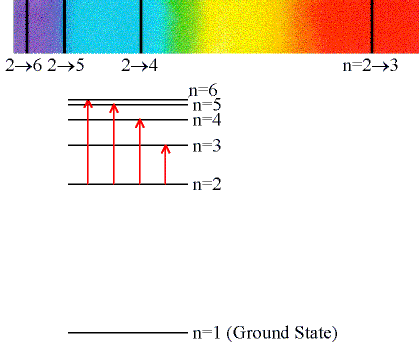
Absorption Lines:
When an electron absorbs a photon with exactly the
energy needed to jump from a lower to a higher orbital.
(Click on the image to view at full scale [Size: 51Kb];
Graphic by R. Pogge)
Absorption is very specific:
- Only photons with the exact excitation energy are absorbed.
- All others pass through unabsorbed.
The excited states decay by emitting photons in random directions.
Fingerprinting Matter
Other atoms have more electrons, and hence more complex
electron orbital structures.
- Results in more complex line spectra.
- There is a unique spectrum for each element, reflecting
its unique electron orbital structure.
- Isotopes show the same lines, but slightly shifted in
wavelength.
Every element has its own, distinctive spectral signature.
The Importance of Spectroscopy
From the emission or absorption lines in an object's spectrum, we can
learn many things of importance, especially:
- Composition: Which elements are present and in what proportions
- Which elements are ionized (missing or extra electrons) in whole or in part
- Which molecules are present
- The temperature, pressure, and density of the gas
These data can give us a nearly complete picture of the physical
conditions in the object, even though that object is separated from
us by cosmic distances.
Updated 8/21/2013 Todd Thompson
Original version by Rick Pogge